
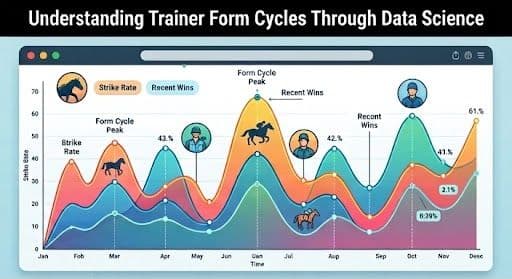
The Ebb and Flow of the Stable
Like any athletic team, racing stables go through periods of peak performance and periods of struggle. A trainer's "form" is a vital metric; if a stable is suffering from a viral infection or a bad batch of feed, even their best horses will underperform.
Conversely, when a stable hits a "hot streak," their horses often run significantly above their historical baselines. Identifying these shifts in stable form early is a key component of successful quantitative analysis.
Statistical Indicators of Stable Form
Our Machine Learning tracks the performance of every horse from every stable on a rolling 14-day and 30-day basis. We look beyond simple win rates, analyzing the percentage of horses finishing in the frame (top 3) and the percentage of horses running to or exceeding their expected speed figures (Run-to-Form percentage).
If a historically average trainer suddenly has 80% of their runners exceeding their expected speed figures over a two-week period, our system flags the stable as "Hot." The algorithm then automatically applies a positive modifier to the probabilities of all upcoming runners from that yard.
Predicting the Cycle Shift
The most lucrative opportunities arise when our Machine Learning predicts a shift in a trainer's form cycle before it becomes obvious to the general public. By analyzing leading indicators—such as horses consistently finishing strongly despite missing the frame—our models can anticipate when a "cold" stable is about to break out, allowing us to capture massive value before the market adjusts.